

uptime chart
This block is part of the Component UI group and was last modified in core v10.4.28.
uptime chart v10.4.28 Uptime chart
- Name required
value - Data required
arrayEach object in the data is a bar, specify a field in the object for the color, and connect it to the color field pin
- Color field required
fielddefinitionsInclude in your object a field with a color,
- Unavailability required
fielddefinitionsWhen the selected field is filled in your object it will be used to calculate the uptime. This field needs to be a date/number with the total downtime in minutes
- Date required
fielddefinitionsThis field will be used to dispaly the day
- Unavailable info required
fielddefinitionsInfo why it was
- Max
numberMax amount of bars in the chart
- Default color
valueThe color of the bar when the downtime/color field is not filled
- uicomponent
uicomponent
graph |
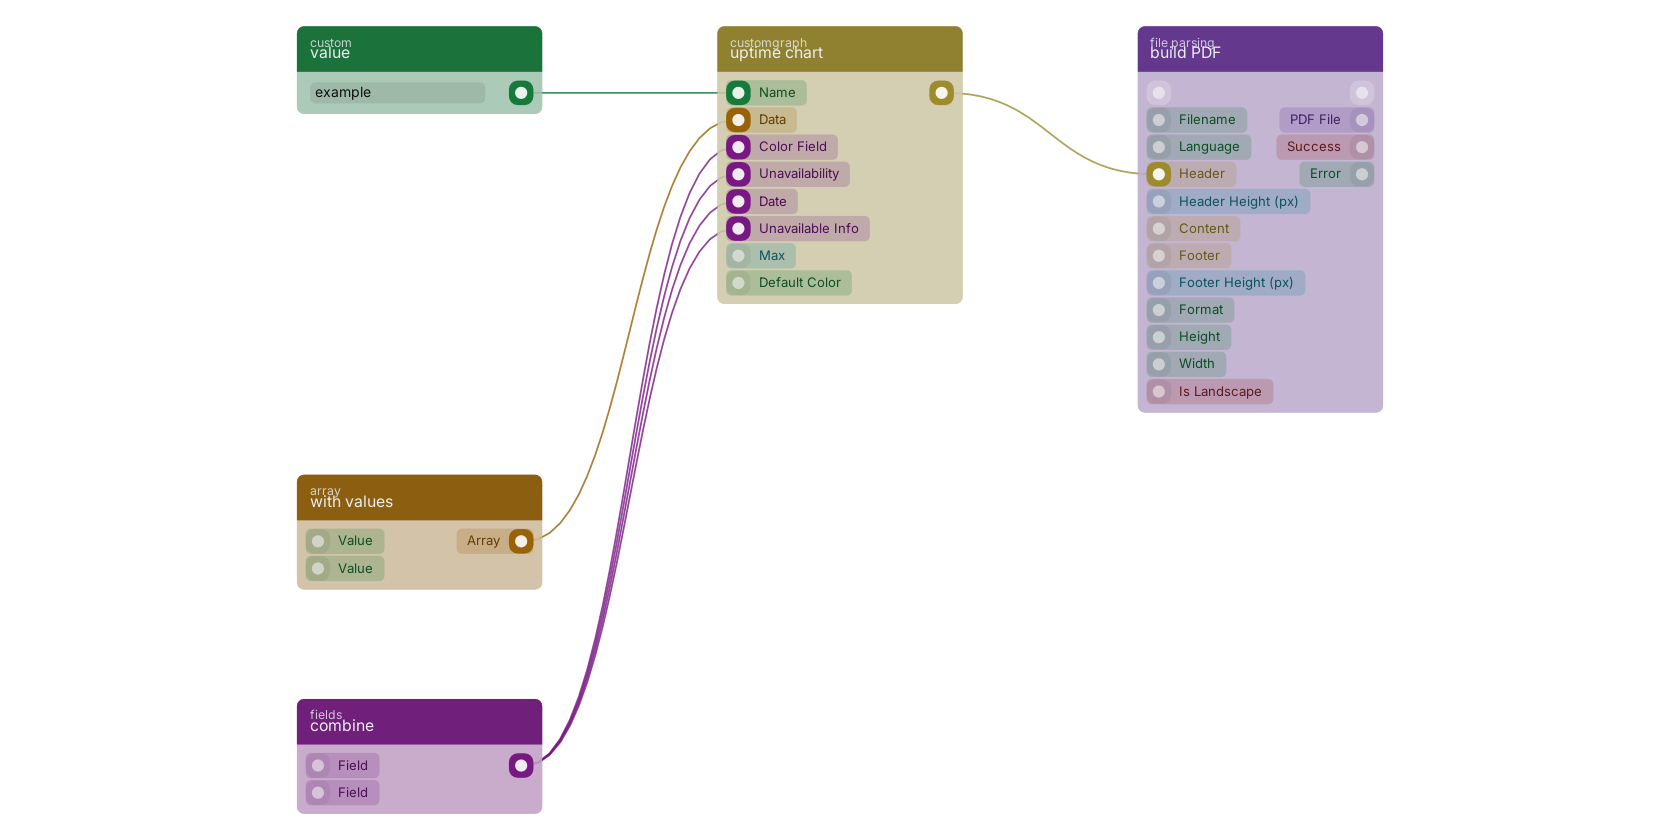
A typical wiring for uptime chart: value feeds the name pin; with values feeds the data pin; combine feeds the colorfield pin; combine feeds the calculatefield pin; combine feeds the datefield pin; combine feeds the unavailableinfo pin; the uicomponent out pin feeds build PDF.
Version history
Introduced in v10.4.28.
Back to
Component UI Return to the main group to view all sub-groups Back to customgraph Return to the group to view all blocks within this group